Cryo-TEM images benefit from adjustments to contrast that allow for features of interest to be seen clearly. Finding a suitable contrast level and adding a scale bar are key steps to making an image interpretable and ready for presentation or publication. The following guide will help you through the process.
Filtering, adjusting the contrast, and adding scale bars to an image are straightforward with ImageJ or FIJI, which are freely available. Batch processing options allow for the same adjustments to be made to a large number of images quickly.
Quick Links to Instructions:
- Applying a Filter and Adjusting Contrast of Individual Images
- Adding Scale Bars to Individual Images
- Adjusting Images and Adding Scale Bars to All Images in a Folder
Contrast Adjustment and Mean Filtering
For each report, NIS provides a zipped folder with all of the associated images. Typically these are the full size images in jpeg format. Each downloaded image is a 2D array of pixel values from 0 to 255. The data is displayed as an image with corresponding grey values between black (intensity value of 0) and white (intensity value of 255).
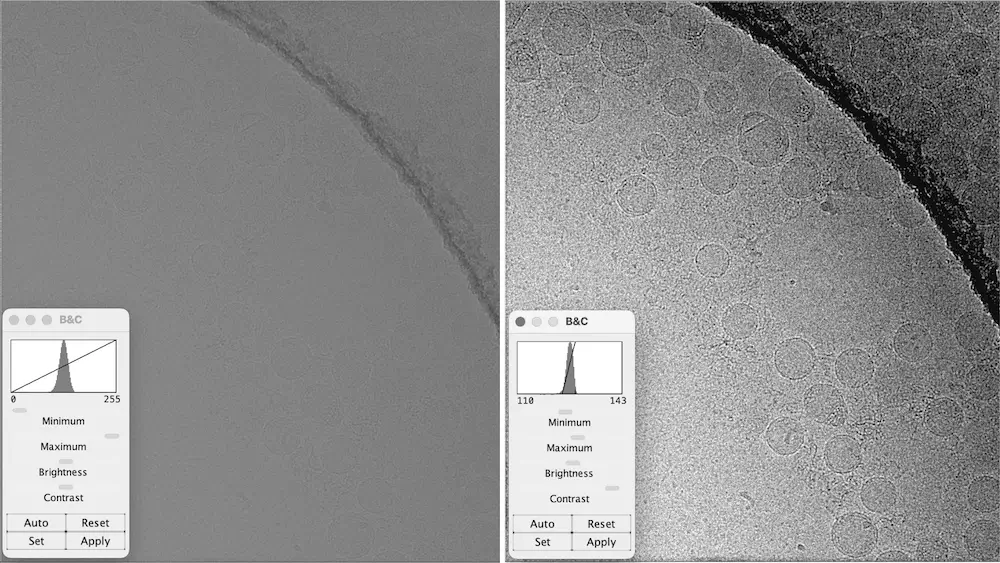
Upon opening an image you may see that the particles are difficult to distinguish (Figure 1A). We can adjust how the intensity values are displayed so that the particles and features are easier to visualize. Moving the minimum and maximum closer to the range of intensity values in the image and including a small percentage of saturated pixels will allow us to more easily see particle details (Figure 1B). Adjusting the contrast of an image changes how the pixel values are displayed but the underlying data remains the same.
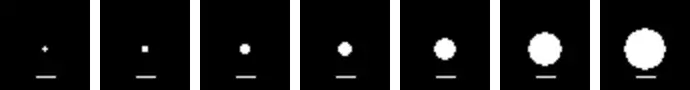
Mean filtering is another way the image can be adjusted to help visualize features of interest. While not always necessary, applying a mean filter helps decrease noise in an image. Unlike contrast adjustment, filtering does change the underlying data by assigning the mean value of a neighborhood of pixels to each pixel. The shapes and sizes of neighborhoods at different radii are shown in Figure 2.
Applying a Filter and Adjusting Contrast of Individual Images
Applying a mean filter and adjusting the contrast in ImageJ for individual images can be done with the following process:
- Open the image with Image J.
- From the menu select Process>Filters>Mean.
- Set the Radius in the resulting pop-up window and select “OK” (see below for tips on how to set the radius).
- From the menu select Image>Adjust>Brightness/Contrast. This will bring up a window called B&C where adjustments can be made (Figure 1).
- You can adjust contrast in 3 ways:
- Adjust the minimum and maximum sliders closer to the range of the intensity histogram.
- Hit “set” in the B&C window and then set the numbers.
- Select “Auto” to optimize the brightness and contrast automatically. “Auto” can be selected multiple times until a good level of contrast is found.
- Save the image by selecting File>Save As from the menu and choose your preferred format. The adjusted image will be saved as a new file separate from the original. We recommend retaining all original image files in addition to the adjusted image.
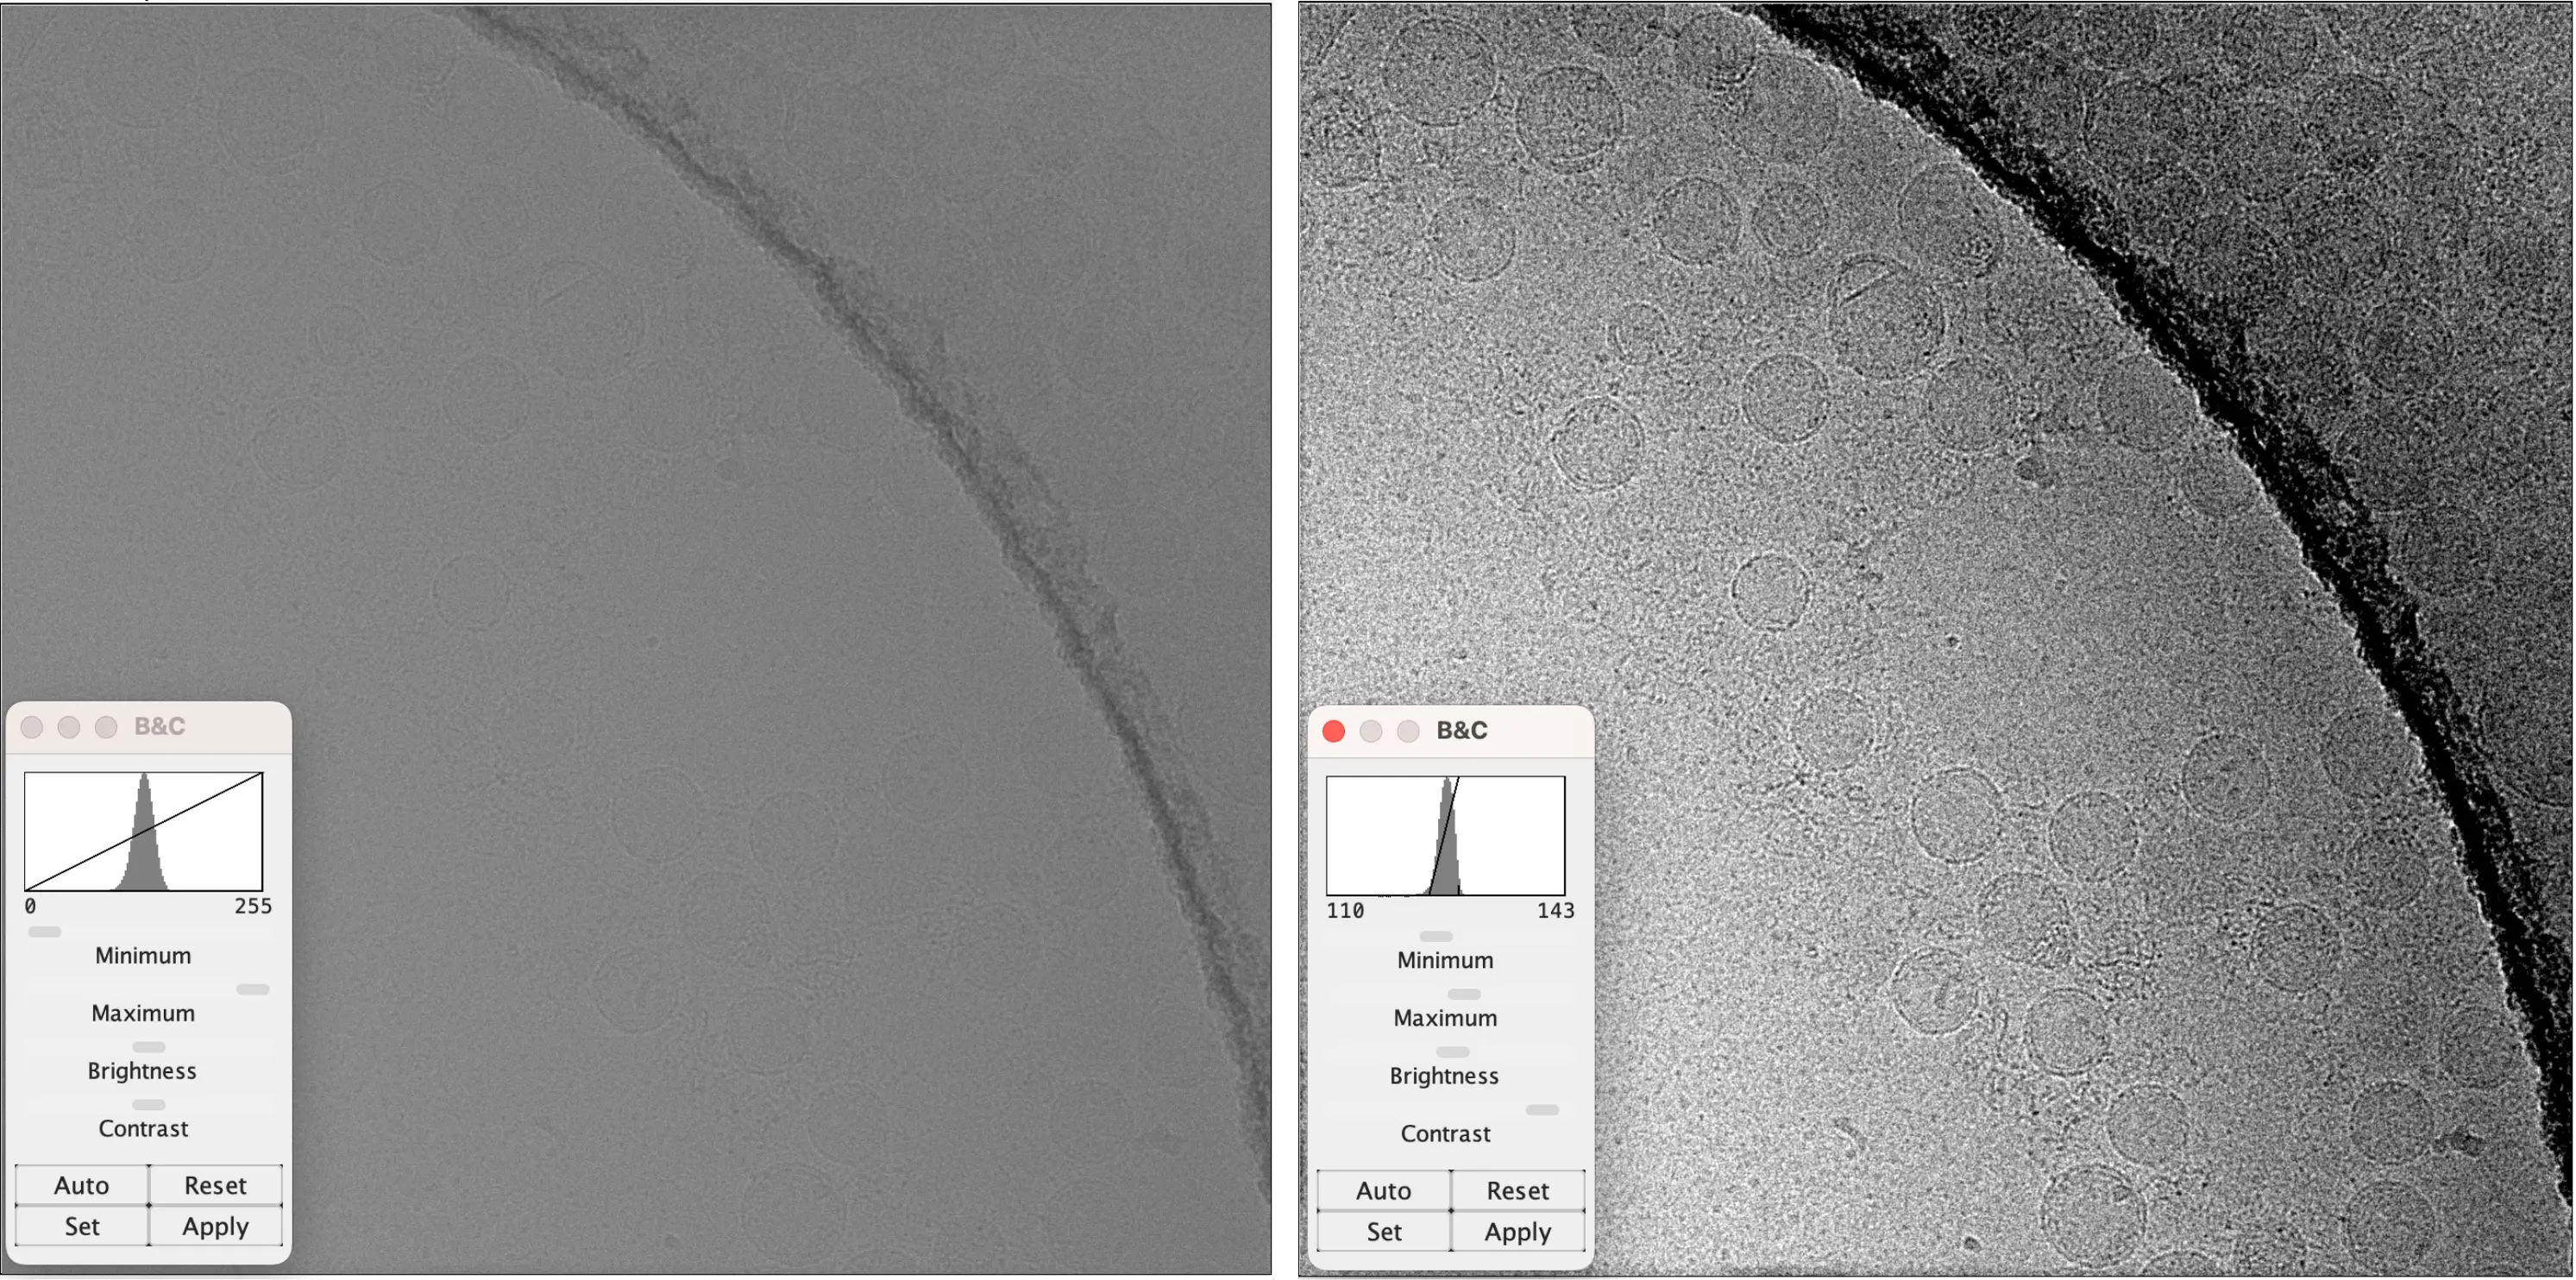
At NIS, cryo-TEM images of nanoparticle samples are acquired with one of our four Glacios microscopes. Each Glacios is equipped with either a Falcon 3 or Falcon 4 direct electron detector. Depending on the detector used, slightly different adjustments may be needed. Mean filtering the image with a radius anywhere between 0.5 and 3 in addition to contrast adjustment typically gives good results (Figure 3).
.webp)
Scale Bars
Images downloaded from our client portal do not have scale bars so that you can choose the size and location as needed. To add a scale bar to individual images, you’ll need to set the scale. The scale will depend on the pixel size for the image magnification which can be found in Section 4 of the report or in the online image viewer above the image.
Adding Scale Bars to Individual Images
Follow these steps to add a scale bar to an individual image:
- After opening the image, choose Analyze>Set Scale from the menu. In the pop-up window:
- Set the “Distance in pixels” field to 1.
- Set the “Known distance” field to the correct pixel size for that magnification.
- Set the “Unit of length” field to nm.
- Select “Global” if you’d like to use this same scale for the next images you open. If the next image will be of a different magnification, leave this box unchecked.
- Select "OK"
- Optional: Select the line tool from the toolbar and then add a line to the image where you’d like the scale bar to appear. This is useful if you’d like the scale bar to appear next to a particular particle or feature.
- Choose Analyze>Tools>Scale Bar from the menu. In the pop-up window:
- Adjust the Width of the scale bar, Thickness in pixels, and Font size as preferred.
- Color and Location can be adjusted. If you drew the optional line in step 2, select “At Selection” from the “Location” dropdown menu.
- Select “OK”.
- Save the image in the preferred format. Example: File>Save As>PNG
Adjusting Images and Adding Scale Bars to All Images in a Folder
To save time, instead of adjusting images individually, we can filter, adjust contrast, and add scale bars to all images in a folder.
- Create an output folder where you’d like the adjusted images to be stored.
- In ImageJ select Process>Batch>Macro from the menu.
- In the pop-up window, set the Input and Output directories and paste the macro into the lower box and select “Process”.
An example macro is shown below that includes mean filtering, contrast adjustment, and the addition of scale bars. Parameters highlighted in yellow can be changed as needed to optimize display of particles, or to specify the size and placement of the scale bar. Parameters highlighted in blue need to be changed to the exact pixel sizes for each magnification (found in section 4 of the report).
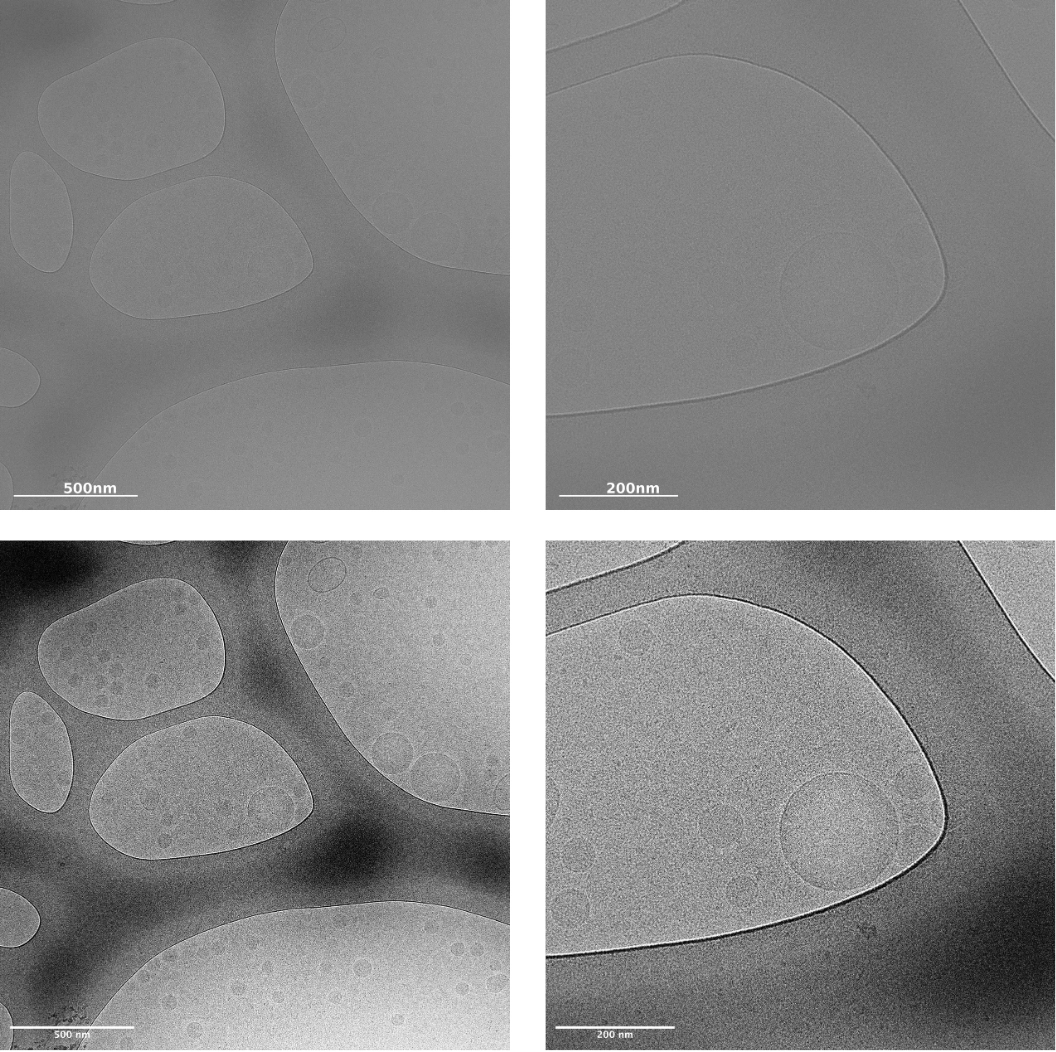
The example macro will mean filter and enhance the contrast of all images in the input directory including the lower magnifications used for targeting. For the high magnification images, which are typically some combination of 28,000x, 73,000x, and 150,000x images, it will also place a scale bar of the specified length in the lower left corner.
Figure 4 shows an image series collected of a lipid nanoparticle (LNP) sample before and after processing with the example macro. Filtering, contrast adjustment and scale bar addition allow us to easily see the particles and get an idea of their size. Because all the images collected of this LNP sample were processed together with the macro, we know they were adjusted in exactly the same way.


Welcome to Finsweet's accessible modal component for Webflow Libraries. This modal uses Webflow Interactions to open and close. It is accessible through custom attributes and custom JavaScript added in the embed block of the component. If you're interested in how this is built, check out the Attributes documentation page for this modal component.
Infographic Available for Download
Tutorial from expert cryo-EM scientists for editing TEM images, improving contrast, and adding scale bars.